Elongations are the meteorological terms for ridges and troughs when air masses change from Highs and Lows with circular cross sections to ellipses and then into tongues joining "like" pressure systems. …
There is quite a deep Low in the Alaska Bay and a not so deep Newfoundlander on here:

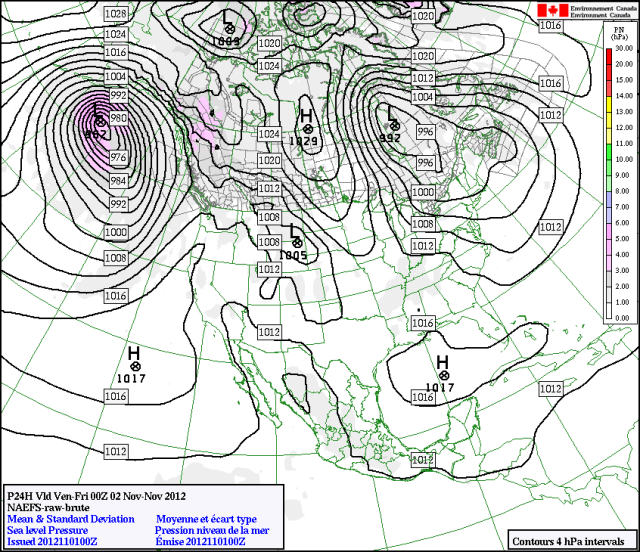
> http://www.weatheroffice.gc.ca/ensemble/naefs/cartes_e.html
The problem is a flaccid High separating them.
With no real storms going on in the tropics and the NEIC pointing to some stuff pending, that leaves us with the North Atlantic and the Southern Hemisphere charts to look at.
Nothing over 4.9 M. between here:
2012/10/30 >>>13:12
5.2 M. Off E. coast of North Island, N.Z.
and here:
2012/11/01 >>>03:15
5.1 M. Queen Charlotte Islands
http://earthquake.usgs.gov/earthquakes/recenteqsww/Quakes/quakes_all.php
The North Atlantic:
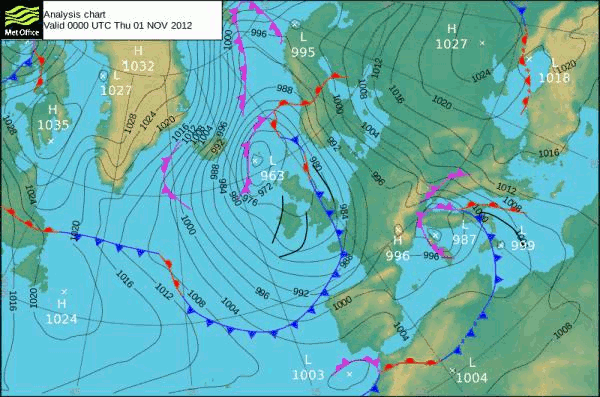
> http://www.metoffice.gov.uk/weather/uk/surface_pressure.html
The southern hemisphere:
Which brings us to the way we understand elongation.
Obviously weather can not cause weather, and since the weather is so intimately connected to the behaviour of earthquakes, it stands to reason they don't cause themselves either. Nor does one cause the other; no more than they are caused by tides.
Which brings us to what causes tides. All that Poincaré; Lord Thomson; Geiky, Darwin and the rest of them ever proved is that we don't know much about tides. They don't follow the moon, for even in the age of supercomputers homo-sapiens in all his glory can't follow the moon, how much less insensible water?
All we do know is that a super-normal mechanism releases the tides to fall behind the clock as though by some universal chronometer regulator. What mighty power this is we don't yet know.
Talking of universal regulators:
The "deep Low in the Alaska Bay and a not so deep Newfoundlander" above are the next signal to us that a large quake is imminent. Actually it is no such thing. A third (middle) Low is required. And this has to replace the High there at the moment. But as there IS a quake due, I am guessing it HAS to appear there.
An absence of large quakes means that a larger one still is due. The lack of a small run of 5 Ms means we will have a 6 M. to make up for it:
"Since the weather is so intimately connected to the behaviour of earthquakes"
Dry or wet, the weather pays its debt
And
Large or small, earthquakes average overall.
The run of charts on the North Atlantic show a Low in dissolution. This fits the overall picture of not a lot happening in the tropics but doesn't tell us much about what is due.
I won't repost any of them. But you can see two pairs of Fronts on the first two charts and then the weather breaks up. This is common with twin earthquakes.
But there should be a reasonably noticeable quake in the Fijian triangle setting up another bout. There are black (thunder) fronts on each chart too. Also symptomatic of quakes but I am not sure how, except that they mean the air is still enough to allow cumulo-nimbus:

http://science.nationalgeographic.com/wallpaper/science/photos/clouds/cumulonimbus-cloud/
The Antarctic runs on the other hand are quite interesting, they contain stuff I have only observed a very few times. I was not then able to draw any conclusions from such behaviour. I am not going to try now…
Probably.

Blast it the animations don't work.
Michael, this post has a copy.. Evidently, you have published it twice. That's usual with Opera nowadays. But you can help.. Don't push that 'Publish' button more than once. If you don't see your new Post, just only use F5 and wait.. Ordinarily, it works.
Originally posted by Weatherlawyer:
This thread was started over a week ago. So not only can large earthquakes be forecast, they can be forecast in plenty of time for all the relevant "experts" to at least prepare for something to emerge. "Emerging agencies."Fat chance of that. Disaster relief efforts are nothing if not moribund. And useless overall.Here is a thread I started on sci.geo.earthquakes at the same time as I posted this thread:Post 1: Looks like I was wrong about the black discs on the Antarctic site. They are just tropical storms.There is a black disc approaching the continent [Antarctica] from the east of Africa and it elongates badly out at sea. Later in the same region an huge dartboard appears at 60 to 80 degrees east:> http://www.bom.gov.au/australia/charts/viewer/index.shtml?type=mslp-p…[A dartboard is a feature of a cyclonic system whose concentric isobars are large enough and close enough to appear like a dartboard. They always forecast large earthquakes.]Lots of storms this spell according to the North Atlantic Charts.Bearing in mind that a spark plug gap for earth's energy budget flashes between the southern tip of Greenland and the coast of Norway whenever the Atlantic lights up like it did with Sandy.[The distance between the southern tip of Greenland and the east coasts of the Atlantic approaches: Iceland, Norway and Britain (Ireland included) are harmonic wavelengths of cyclonic storms.Imagine the sound that storms make having a wavelength that forms nodes exactly matching those distances of open water.]Large dartboards mean large earthquakes. But now I am stymied with the black discs of precipitation shown on these runs. Lots more parallel stuff too unless that's just leftovers from that Canadian stuff.Look out for give-away signs on this chart:> http://www.weatheroffice.gc.ca/ensemble/naefs/cartes_e.html
Post 3 on that Usenet thread about 24 hours later:I got so wrapped up in this I never even realised the dartboard on the Canadian GFS ensemble was Sandy.You can still see it here for a few weeks:> http://www.weatheroffice.gc.ca/ensemble/naefs/cartes_e.htmlJust click to see sea level pressure charts and scroll back on bothtabs to get the appropriate dates. I was looking to see the Charlotte Effect.There was a line up of three Lows of sorts beginning at say the 26th(issue date) and 27th (forecast date.)The central Low (already out of line laterally) moves further northwith the arrival of the hurricane then Kaboom!… All change on the28th (Forecast for the 29th.)[The Canadian charts are available online at the above address but only for a limited period. If you are serious about weather and earthquakes and want to do your own research you have to familiarise yourself with the behaviour of these pages and download them as and when you can.]Nothing much here since these:2012/10/30 02:555.0 M. 52.5 N. 131.5 W. QUEEN CHARLOTTE ISLANDS REGION2012/10/30 02:496.2 M. 52.3 N. 131.9 W. QUEEN CHARLOTTE ISLANDS REGION(In fact there is a lot of due, due according to this:>http://earthquake.usgs.gov/earthquakes/recenteqsww/Quakes/quakes_all.php)The last advisory for Sandy was 30 at:38.80 N. 74.40 W. on the 29th October 2012 @ 21:00.It was an 80 knot, Cat 1 (with a minimum pressure of 940 millibars at that time.)[I then got involved with trying to match angular distances with these weather charts. I tried to find the distances in degrees of the epicentre form what was reportedly the centre of Sandy at the time of the earthquake.How far is that from the Queen Charlotte epicentres?Distance: 4710 kmInitial bearing: 309°04′01″Final bearing: 265°07′00″> http://www.movable-type.co.uk/scripts/latlong.htmlThat can't be right can it?I would have said 70 to 130 degrees was considerably further than 40degrees apart.60 would have fit my understanding of geotectonics better than 42.[I was hoping to find an angle that was more suited to my tastes such as 60 degrees. And it doesn't help that I am a dunce at maths.]Ah well, going back to the weather chart, if anyone had been watching the forecast from the 25th for the 28th he might have made out three lows in the row.Not enough to tell him anything much though.Better luck next time.[Like I said. better luck next time. Pity I hadn't made myself clearer. I should have realised next time wasn't far off.]
3rd November 012. Post 4. what the hell was anyone supposed to make of this:2012/11/02 18:176.1 M. 9.3 N. 126.2 E. MINDANAO, PHILIPPINES> http://earthquake.usgs.gov/earthquakes/recenteqsww/Quakes/quakes_all.phpCompare:> http://earthquake.usgs.gov/earthquakes/map/#data:eyJyZXFjb25maWciOnsi…No instigation from the Fijian Triangle. And no sign of a storm.All very odd.Plenty of elongation on here:> http://www.bom.gov.au/australia/charts/viewer/index.shtml?type=mslp-p…Not sure what that will lead to but I am working on it. (Australian n- day wave for example.)
What I was actually thinking about was that the usually constant anticyclone to the left of Australia on the chart at the link given, was being forced across that continent by a comma of elongated Low pressure:
Posts 5 and 6, my first inkling that we are due another large quake:> http://www.metoffice.gov.uk/weather/uk/surface_pressure.html> We might finally get some tornadic stuff on the 6th November 2012.> (Noon Tuesday.)> Almost all tropical storm activity has ceased. I can't see that more> is developing -by the Antarctic chart at least. There is an hideous/> beautiful rash of fronts on the first North Atlantic chart of the day> for today (Sunday the 4th)> http://www.metoffice.gov.uk/weather/uk/surface_pressure.html4th4.7 M. 17:07 SOUTH OF THE FIJI ISLANDS4.9 M. 00:16 VANUATU3rd4.9 M. 20:49 FIJI REGIONSomething stirs Leviathan.http://groups.google.com/group/sci.geo.earthquakes/browse_frm/thread/04b07ae57ffa3fb5/2771a5b6b0629b71#The actual description of a leviathon is most like a volcano than anything like an earthquake, though they have very similar root causes:http://www.biblegateway.com/passage/?search=Job+41&version=NIV
To be honest, I don't believe it is over yet.
Looking at that post it becomes clear to me I am lost in my own little world of earthquake forecasting.What I wrote makes a great deal of sense to me but then, I know what I am talking about. I just lack communication skills.Put simply:That Canadian quake was signalled by two Lows on the coasts of Canada. All they lacked was a middle Low to complete the trio and that obliged on the 28th of October, the day before I published this stuff.:2012-10-28 at: 03:04 GMT.7.8 Magnitude; 141km S of Masset, Canada.52.742°N. 132.131°W.But I had been looking at the Antarctic charts from the week up to then in search of something else:The behaviour of elongations.When the weather is about to change, well established systems become unstable. Well rounded air masses become ovals and eventually spring a leak and sent out a feeler sideways on a chart. If the system is anticyclonic, the arm it sends out is called a ridge.If the system is cyclonic the arm is called a trough.And even in decline, they don't reach out one to another, but they appear to reach out like feelers trying to find a new place to go to.Thus Lows go to new Lows and Highs move into the territory vacated by old Highs. The more the weather changes, the more it stays the same.But on a scale that encompasses a complete hemisphere, it sometimes appears that a an whole system is out of kilter. That the make up of every system is in elongation.And never was a well set up series of circular air masses in the first place. I am so used to thinking in terms of free flowing cyclones with pretty nearly symmetrical cross sections that I haven't had enough experience to understand an alternative set up.
I believe with the explanation given, you shouldn't have too much difficulty following the remaining 4 posts:http://groups.google.com/group/sci.geo.earthquakes/browse_frm/thread/04b07ae57ffa3fb5/2771a5b6b0629b71#"By my reckoning a large six M. or maybe even a seven is going to occur according to the North Atlantic and NA EFS."[The two northern hemisphere charts I was talking about above.]
Just browsing some totally different stuff when I came across a reference to Charles Fort of the Fortean Times fame:"Colin Wilson suspects that Fort took few if any of his "explanations" seriously, and notes that Fort made "no attempt to present a coherent argument".Moreover, Wilson opines that Fort's writing style is "atrocious" and "almost unreadable". Wilson also compares Fort to Robert Ripley, a contemporary writer who found major success hunting oddities and speculates that Fort's idiosyncratic prose might have kept him from greater popular success.Jerome Clark writes that Fort was "essentially a satirist hugely sceptical of human beings' – especially scientists' – claims to ultimate knowledge".Clark describes Fort's writing style as a "distinctive blend of mocking humour, penetrating insight, and calculated outrageousness"."Well I believe most of what I write. It's just that I have the inability to compose my thoughts until after I have published them.What do you can a man who loves encyclopaedias?Noel.What do you call a man whose knowledge bombs?Teller.